
When learning how to use technical analysis in trading, one of the first things a trader needs to understand is moving averages.
Moving averages can be used in a number of ways, and there are many different types to choose from.
But what are they and how do traders use them? In this guide, we'll explain what moving averages are and how to use them in a trading strategy.
Moving averages are a trend-following indicator - with their values and movement based on past prices. This means that the MA cannot warn traders about future price movements, but would come in handy when identifying trend changes. In technical analysis, the moving average (MA) is one of the most commonly used tools.
Traders may be wondering why the MA would be helpful. It is mainly because it smoothes out price action and prevents short-term price fluctuations by filtering out the “noise”. This means it’s essentially calculating the average of the highs and lows of the price for a set number of periods, using historical data from price movement. This is plotted alongside the price on a line, and it constantly updates itself as the price changes.
There are 2 main types of moving averages that are commonly used:
The main difference between the SMA and EMA is their speed. This is because, in its calculation, the EMA gives more weight to the most recent price action and less weight to older price action. When the price changes direction or spikes/dips, the EMA recognises this sooner, while the SMA takes longer to turn when the price turns.
Given that the EMA is closer to price changes, the SMA produces a smoother line compared to the EMA. However, the EMA will always move more closely to the current market price.
This table below summarises simply when it's best to use the EMA and SMA:
| SMA | EMA |
| Best when holding the position for a long period of time (is not affected by sudden dips or spikes in price) | Best for shorter time frame trades (given the quicker speed of recognising price changes) |
| Great in filtering out noise in the market | Good when the market is moving quickly |
Note: There is also the Weighted Moving Average – which essentially functions almost similar to the Exponential Moving Average.
We need the moving average (MA) to identify trends and confirm reversals. We can decipher where the price is trending based on where the MA is in relation to price.
I’ll explain what we mean in the illustration below:
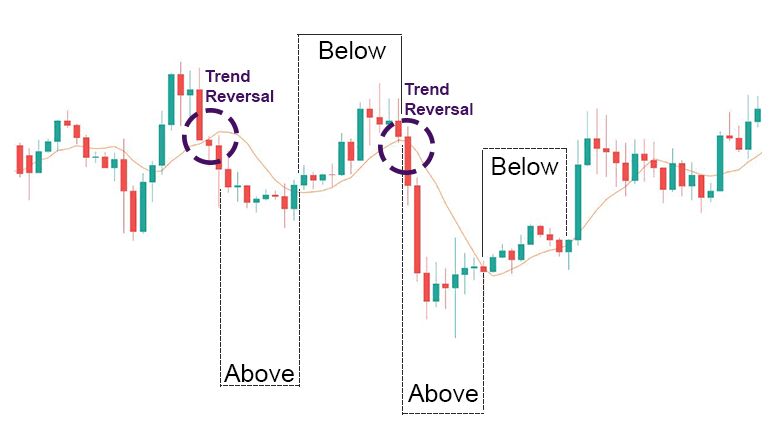
As seen from the image above, when the price crosses a moving average, it signals that there is a reversal in trend. Oftentimes, the price will find support at MA when the trend is up, and resistance at MA when the trend is down.
We can broadly decipher that:
Traders may be wondering why there is a need to know how the different moving averages are calculated when they can just pop them onto their charts with a click. We’ll explain why.
This applies to any other indicator out there - understanding how an indicator works means a trader can adjust and create different strategies as the market environment changes.
It's true, indicators are usually always calculated and plotted nicely onto the graphs for a user. However, by understanding how each moving average is calculated, it will help traders identify the right MA to use, and know what settings to tweak so it yields more accurate results.
That makes sense, right?
As we mentioned above, there are 2 main types of moving averages. They are the Simple Moving Average (SMA) and Exponential Moving Average (EMA).
Let’s say we want to calculate the MAs of a 10-day range.
The SMA will take all the prices within the past 10 days added together, and divide by 10 to give the average.
The EMA, on the other hand, will weigh the difference between the current period's price and the previous EMA and add the result to the previous EMA - so that the most recent price will take more weight while the older price is weighted less.
Let’s calculate this together with the following data set of 10 prices:
$10, $11, $11, $12, $14, $15, $17, $19, $20, $21
To calculate the SMA, we add all 10 prices together and divide it by 10 -
10 + 11 + 11 + 12+ 14 + 15 + 17 + 19 + 20 + 21 = 150
Then just divide it by the number of periods - in this case: 10.
Hence, we can conclude that the 10-day period SMA is $150/10 = $15
To Calculate an EMA, we use this 3-step formula:
Using the previous data set of 10 values, we have established that the SMA is $15.
Let’s calculate step 2.
The formula for calculating the weighting multiplier looks like this:
Weighting Multiplier = 2 ÷ (selected time period+1)
In our case,
Weighting Multiplier = 2 ÷ (10+1)
= 0.1818
= 18.18%
Using this, we can now calculate our EMA using this formula:
where:
t = today
y = yesterday
N = number of days in EMA
k = 2÷(N+1)
Adding our figures into the formula,
EMA = Price(t)×k+EMA(y)×(1−k)
= 21 x 0.1818 + 15 x (1-0.1818)
= 3.8178 + (15 x 0.8182)
= 16.0908
A quick comparison:
| Last price | SMA | EMA |
| 21 | 15 | 16.0908 |
We can see that the EMA is closer to the last price than the SMA. This is due to the fact that the rise in price in our data set was calculated with a heavier weightage in the EMA than the SMA.
In the example above, we calculated both the SMA and EMA with 10 days' worth of data. This makes it a 10-period SMA / EMA.
When calculating moving averages, the time period used should depend on how closely the trader wants to follow the trend.
This table should provide a good estimate:
| Short-term trend | 10 - 30 periods |
| Mid-term trend | 50 periods |
| Long-term trend | up to 200 period |
Most traders use 50-day, 100-day, and 200-day periods as they help identify the most significant long-term support and resistance levels. Using a larger number of periods allows more data to be studied, allowing for a more unbiased view of the overall trend.
Of course, study the charts well before deciding how many periods work best for the technical analysis being conducted. We will cover more about that in the next chapter!
In this section, we will explain what the natural moving average is and how it differs from the SMA and EMA which we discussed earlier.
We believe that each market has its own unique characteristics. This means that using generic default settings may not yield accurate results. In order to accurately derive conclusions from the trends in the market, there should be a unique moving average to cater specifically to that market.
As we mentioned earlier, many traders stick with the default 50, 100, and 200-time frames. However, this will not always be accurate. Natural moving average enthusiasts believe that by finding a market’s natural moving average, they are able to catch the support and resistance areas more accurately. This is done with a combination of the Golden Ratio (Fibonacci Numbers) and past price movements.
It is important to note that Natural Moving Averages only work in trending markets. It does not work in a sideways-moving market.
It is also important to note that the Natural Moving Average is not a different way of calculating the Moving Average, but an application of the existing Moving Averages. This means that this concept can be applied to both the SMA and the EMA.
The natural moving average is Fibonacci-based. All that is needed to know is that Fibonacci is a mathematical sequence that is strong to the golden ratio – these numbers have been proven to be naturally occurring, most pleasing to the eye, etc. These numbers are ingrained into the core of our earth and being, and Fibonacci essentially projects that market movements are likely to follow this sequence (or at least have a tendency to be drawn towards them). Learn more about Fibonacci here.
In order to use the natural moving average, traders must first know the Fibonacci numbers.
The Fibonacci Numbers are:
0, 1, 1, 2, 3, 5, 8, 13, 21, 34, 55, 89, 144, 233, 377, 610, 987, 1597, 2584, 4181, 6765, 10946, 17711, 28657, 46368, 75025, 121393, 196418, 317811, ...
What traders essentially have to do is apply each Fibonacci number by trial and error into the chart’s EMA or SMA time-frame settings. (Whether they use the EMA or SMA depends on which one they feel is most applicable to the asset they are analysing.)
By trial and error, traders identify which Fibonacci number provides the MA line with the most number of price touches, without price breaking above/below it. Also, the price should not be too far away from the line – if that is the case, the time frame used may be too large.
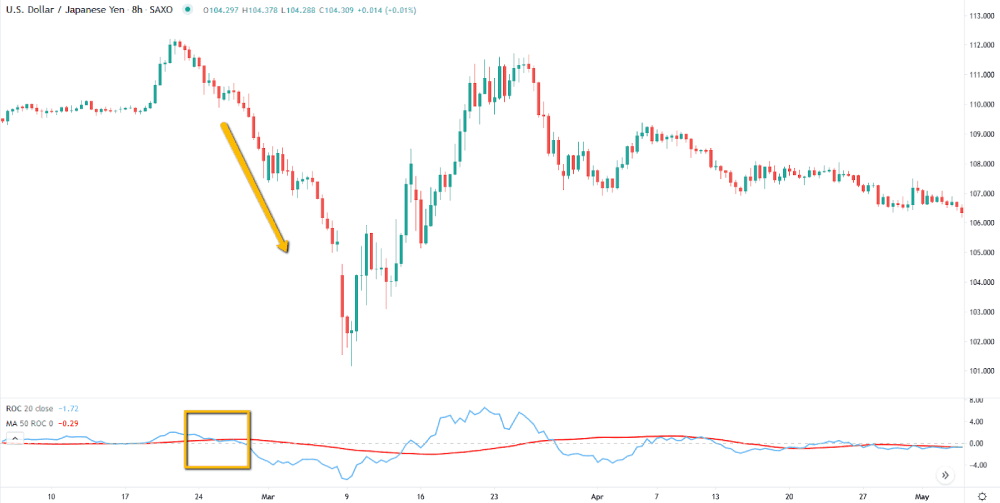
Let’s illustrate this with USDJPY, 8hr chart as an example:
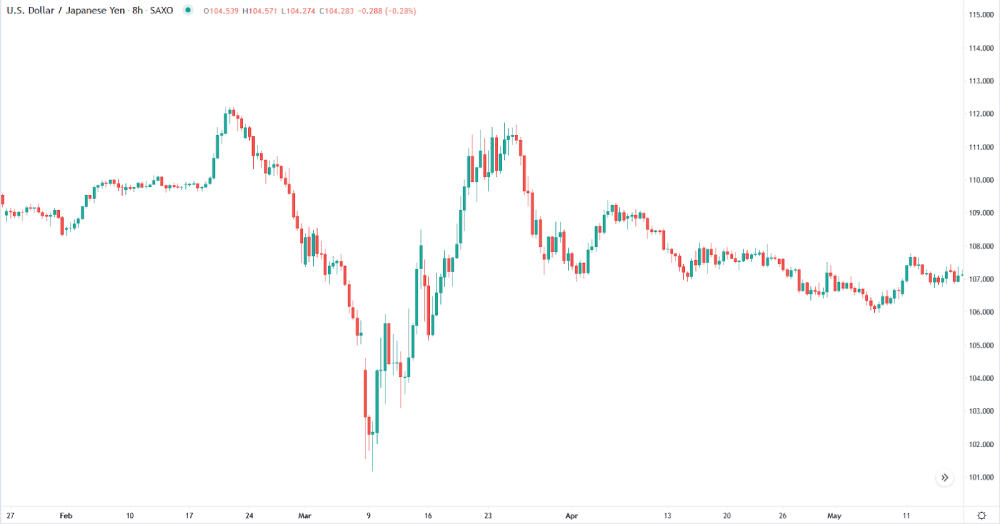
First, let’s identify the trends. As mentioned before, the natural moving average only works in trending markets.
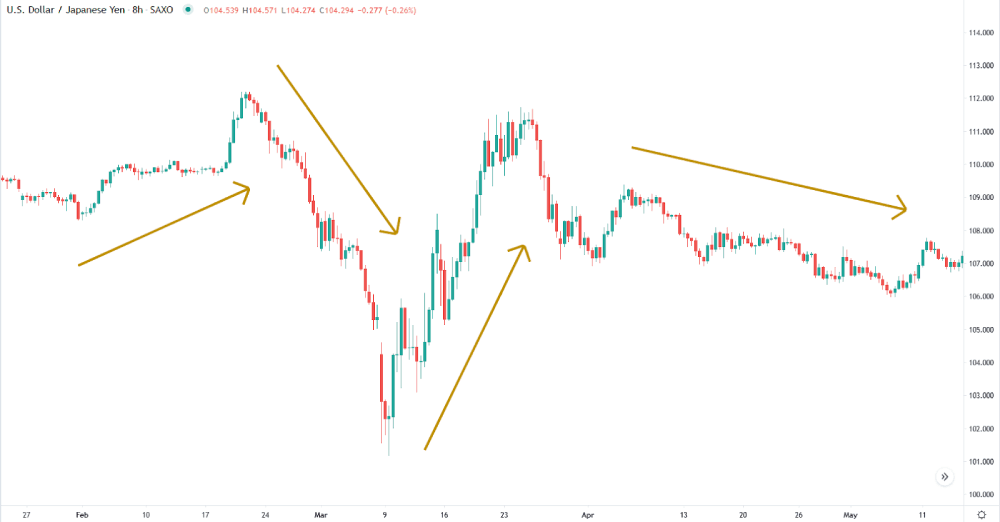
As seen above, 4 main trends have been identified using the Golden arrows.
Now, take note of the placement of these trends, as a trader will have to put on a Moving Average indicator and start toggling the time-frame settings to find which number will produce a line that best follows the market.
For this example, we will use the Exponential Moving Average Indicator.
Once the indicator is on the chart, begin testing the Fibonacci numbers to look for the Natural Moving Average. The Natural Moving Average should not be too tight nor too loose – since the MA functions as a support or resistance line, the MA should sit nicely along the trends with as many points as possible bouncing off it.
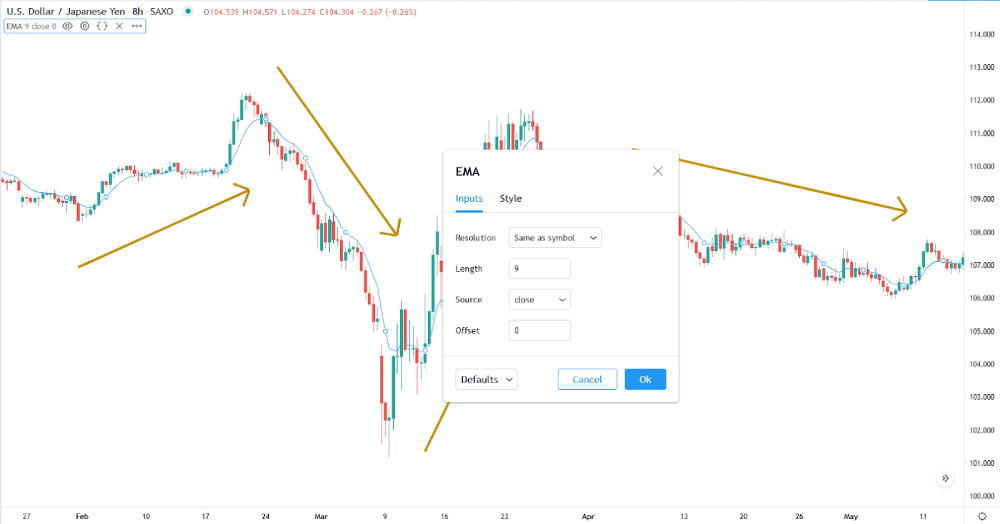
By default, the length (or time frame) is set at 9. Observing the blue line in relation to the candlesticks in the graph, this line is too tight – it is moving too close to the price. As we learned previously MA should help us reduce the “noise” in the market, having a small time frame does not reduce the noise. From this, we know we need to try a bigger time frame.
Here are some Fibonacci numbers bigger than 9 that we can try:
13, 21, 34, 55, 89, 144…
For a start, let’s try 89.
The screenshot below shows what the EMA looks like when the period is set at 89
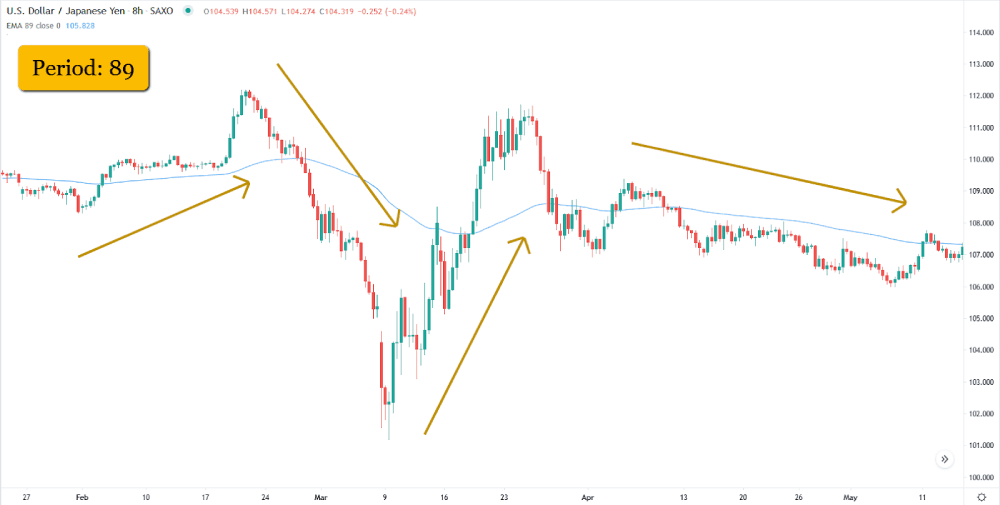
As we can tell, 89 is probably too wide a time frame as the price does not touch the start, middle, and end points of the big trend identified by Golden arrows 2 and 3. So we are ruling out both 89 and 144. And next,
13, 21, 34, 55, 89, 144…
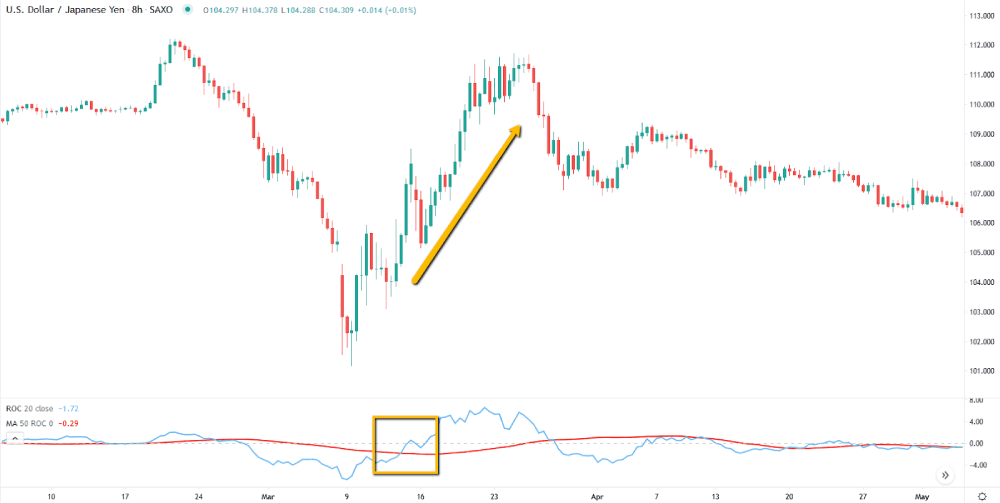
Let’s try a smaller time frame to see if it may be better. The screenshot below shows the EMA with a 34-time frame.
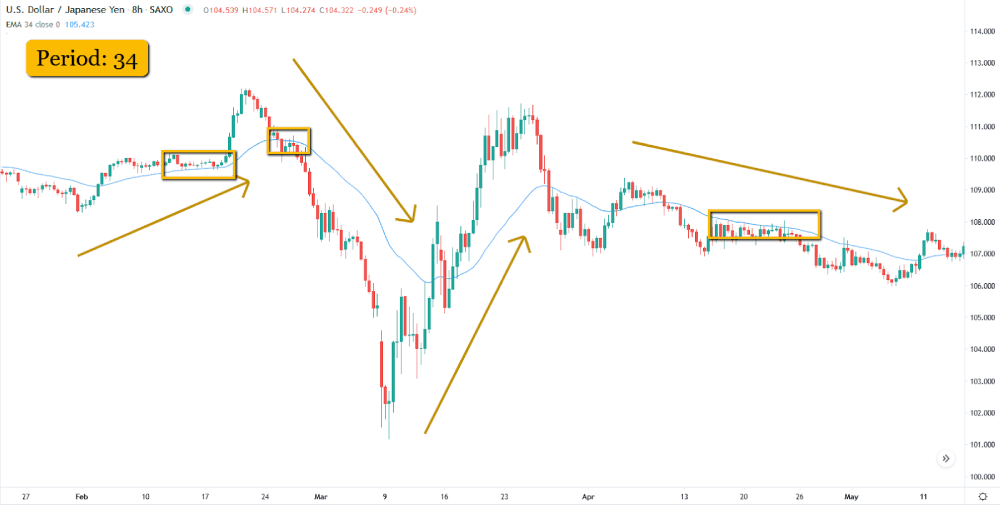
As seen in the screenshot, the price bounces off the EMA at multiple points (in yellow boxes) within a trend. Where a trend is continuing, the price does not break the EMA. This seems to be most accurate at the downtrend, as we can see from the circled portions – 2 of the 3 are on the downtrend.
From this, we can safely say that in a downtrend, 34 is a strong natural moving average for USDJPY in this particular time frame. Note that prices change over time and we, as traders should remain adaptable and flexible to any market condition.
This is a pretty straightforward concept, but also a very useful one. Once traders grasp it, they can apply it to any graph out there.
Find out in the next section how to use moving averages and the main ways traders use an MA to identify signals.
There are 3 main ways of using the Moving Averages for signal generation:
Each of these crossovers can be used in both bullish and bearish scenarios. The difference between these 3 ways is the matching of different elements with the Moving Average (MA).
This method is a combination of the Price data and the Moving Average. It is the simplest and most popular method of interpreting a moving average.
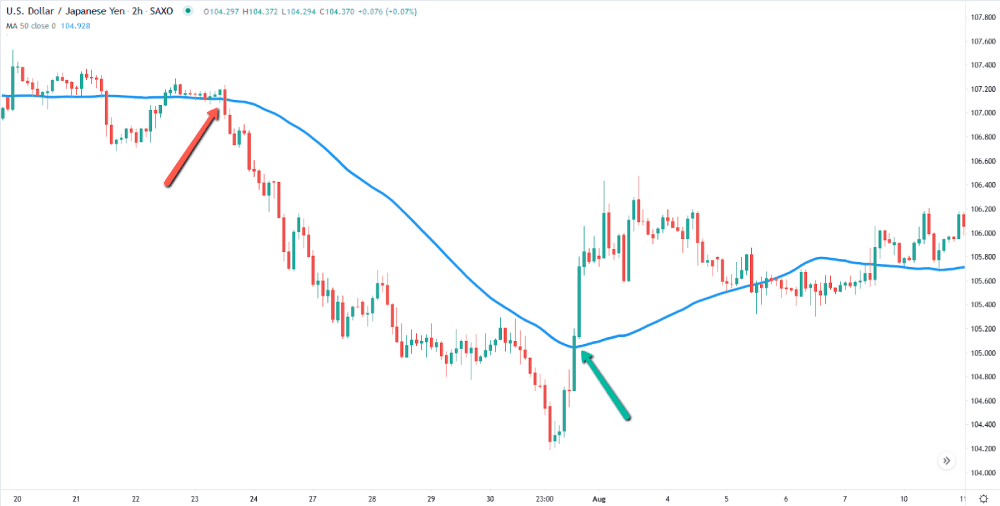
In the example above, using the USD/JPY chart at the 2-hour timeframe, with a 50-period SMA represented by the Blue line. When the candle indicated by the red arrow closes beneath the blue line, the price continues to head in a bearish direction. When the candle indicated by the green arrow closes above the blue line, the price continues to head in a bullish direction.
This method is the combination of Multiple Moving Averages. Where a signal to take action is generated when the lines cross each other on the price charts.
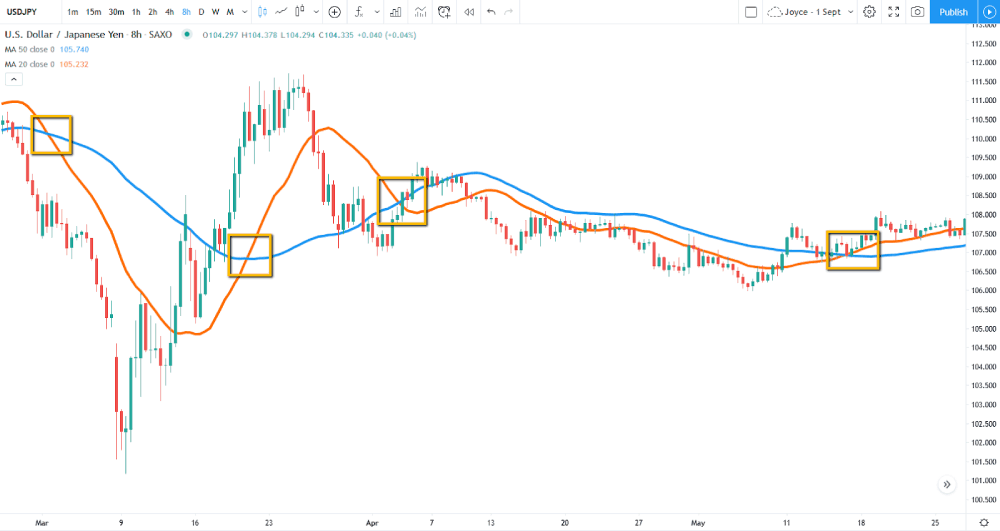
In this example above, we are using 2 Moving averages. A 20-period Moving average (Orange Line) has been added on top of the 50-period Moving average (Blue Line). You can see that the orange line moves closer to the price. The signal for bullish momentum is spotted when the orange line crosses above the blue, and bearish momentum is spotted when the orange line crosses under the blue.
As indicated by the yellow boxes on the image, how much bullish and bearish momentum is spotted? (Hint: 2 bullish, 2 bearish)
Last but not least, we have the indicator crossover which is a combination of putting a Moving Average (MA) into an indicator.
In this example, we have a Rate of Change(20-period) indicator underneath the price chart. And now, we will be adding a 50-period MA into the ROC indicator window, instead of the price chart.
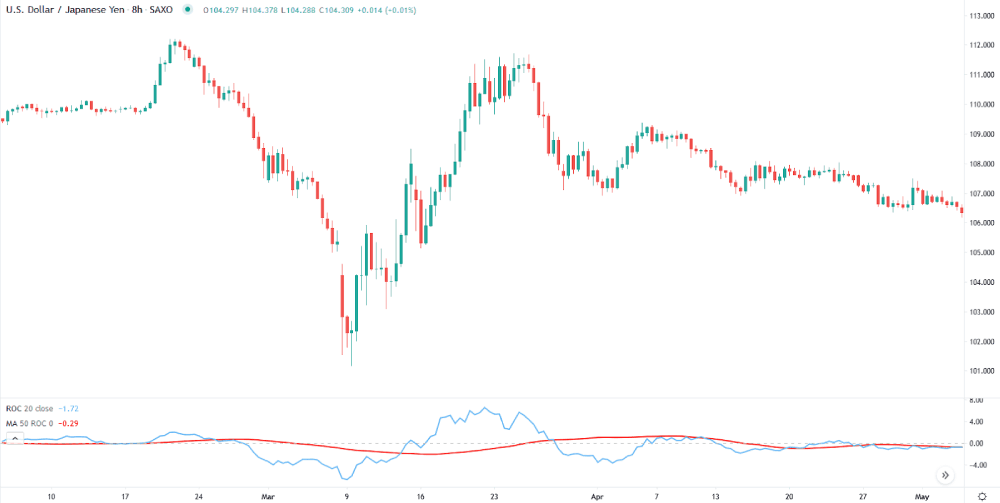
The 50-period moving average is represented by the smooth red line, while ROC is represented by the Light Blue line. And a signal is generated every time ROC crosses the 50-period moving average.
A bearish signal is generated when the ROC crosses above the 50-period MA, notice how the price continues to drop further as the ROC remains under the 50-period MA.
A bullish signal is generated the moment ROC crosses back above the 50-period moving average. Traders can also adjust the sensitivity of the Moving Average and Rate-of-Change to generate more signals if the market is not trending in big moves like this example.
Ready to trade your edge?
Join thousands of traders and trade CFDs on forex, shares, indices, commodities, and cryptocurrencies!
This information is not to be construed as a recommendation; or an offer to buy or sell; or the solicitation of an offer to buy or sell any security, financial product, or instrument; or to participate in any trading strategy. It has been prepared without taking your objectives, financial situation, or needs into account. Any references to past performance and forecasts are not reliable indicators of future results. Axi makes no representation and assumes no liability regarding the accuracy and completeness of the content in this publication. Readers should seek their own advice.
FAQ
The moving average indicator is one of the most popular indicators in technical analysis, used by investors and traders alike. This is partly due to the fact that moving averages are relatively simple to understand and use, requiring minimal knowledge of statistics or other complex mathematical concepts. However, the popularity of moving averages can also be attributed to the fact that they can be a highly effective forecasting tool, providing valuable information about likely future trends in prices.
There is no single moving average indicator that is universally considered to be the best for forex traders. Each indicator excels at certain trading objectives, and selecting the right one for a trader's needs will depend on their preferred trading strategy and risk tolerance. One popular moving average indicator is the simple moving average, which tracks the average value of a price over a set period of time. This type of moving average is ideal for identifying trends in short-term price movements and can be especially useful when used together with other indicators or technical analysis tools.
When it comes to moving average indicators, there are a number of different combinations that can be used to achieve better trading results. Perhaps the most popular moving average crossover combination is a moving average of 10 days combined with a moving average of 20 days. Both moving averages are typically plotted on a graph, with prices moving up and down over time to indicate market trends. When these two moving averages intersect in such a way that the shorter moving average crosses above the longer moving average, this is called a bullish crossover.