

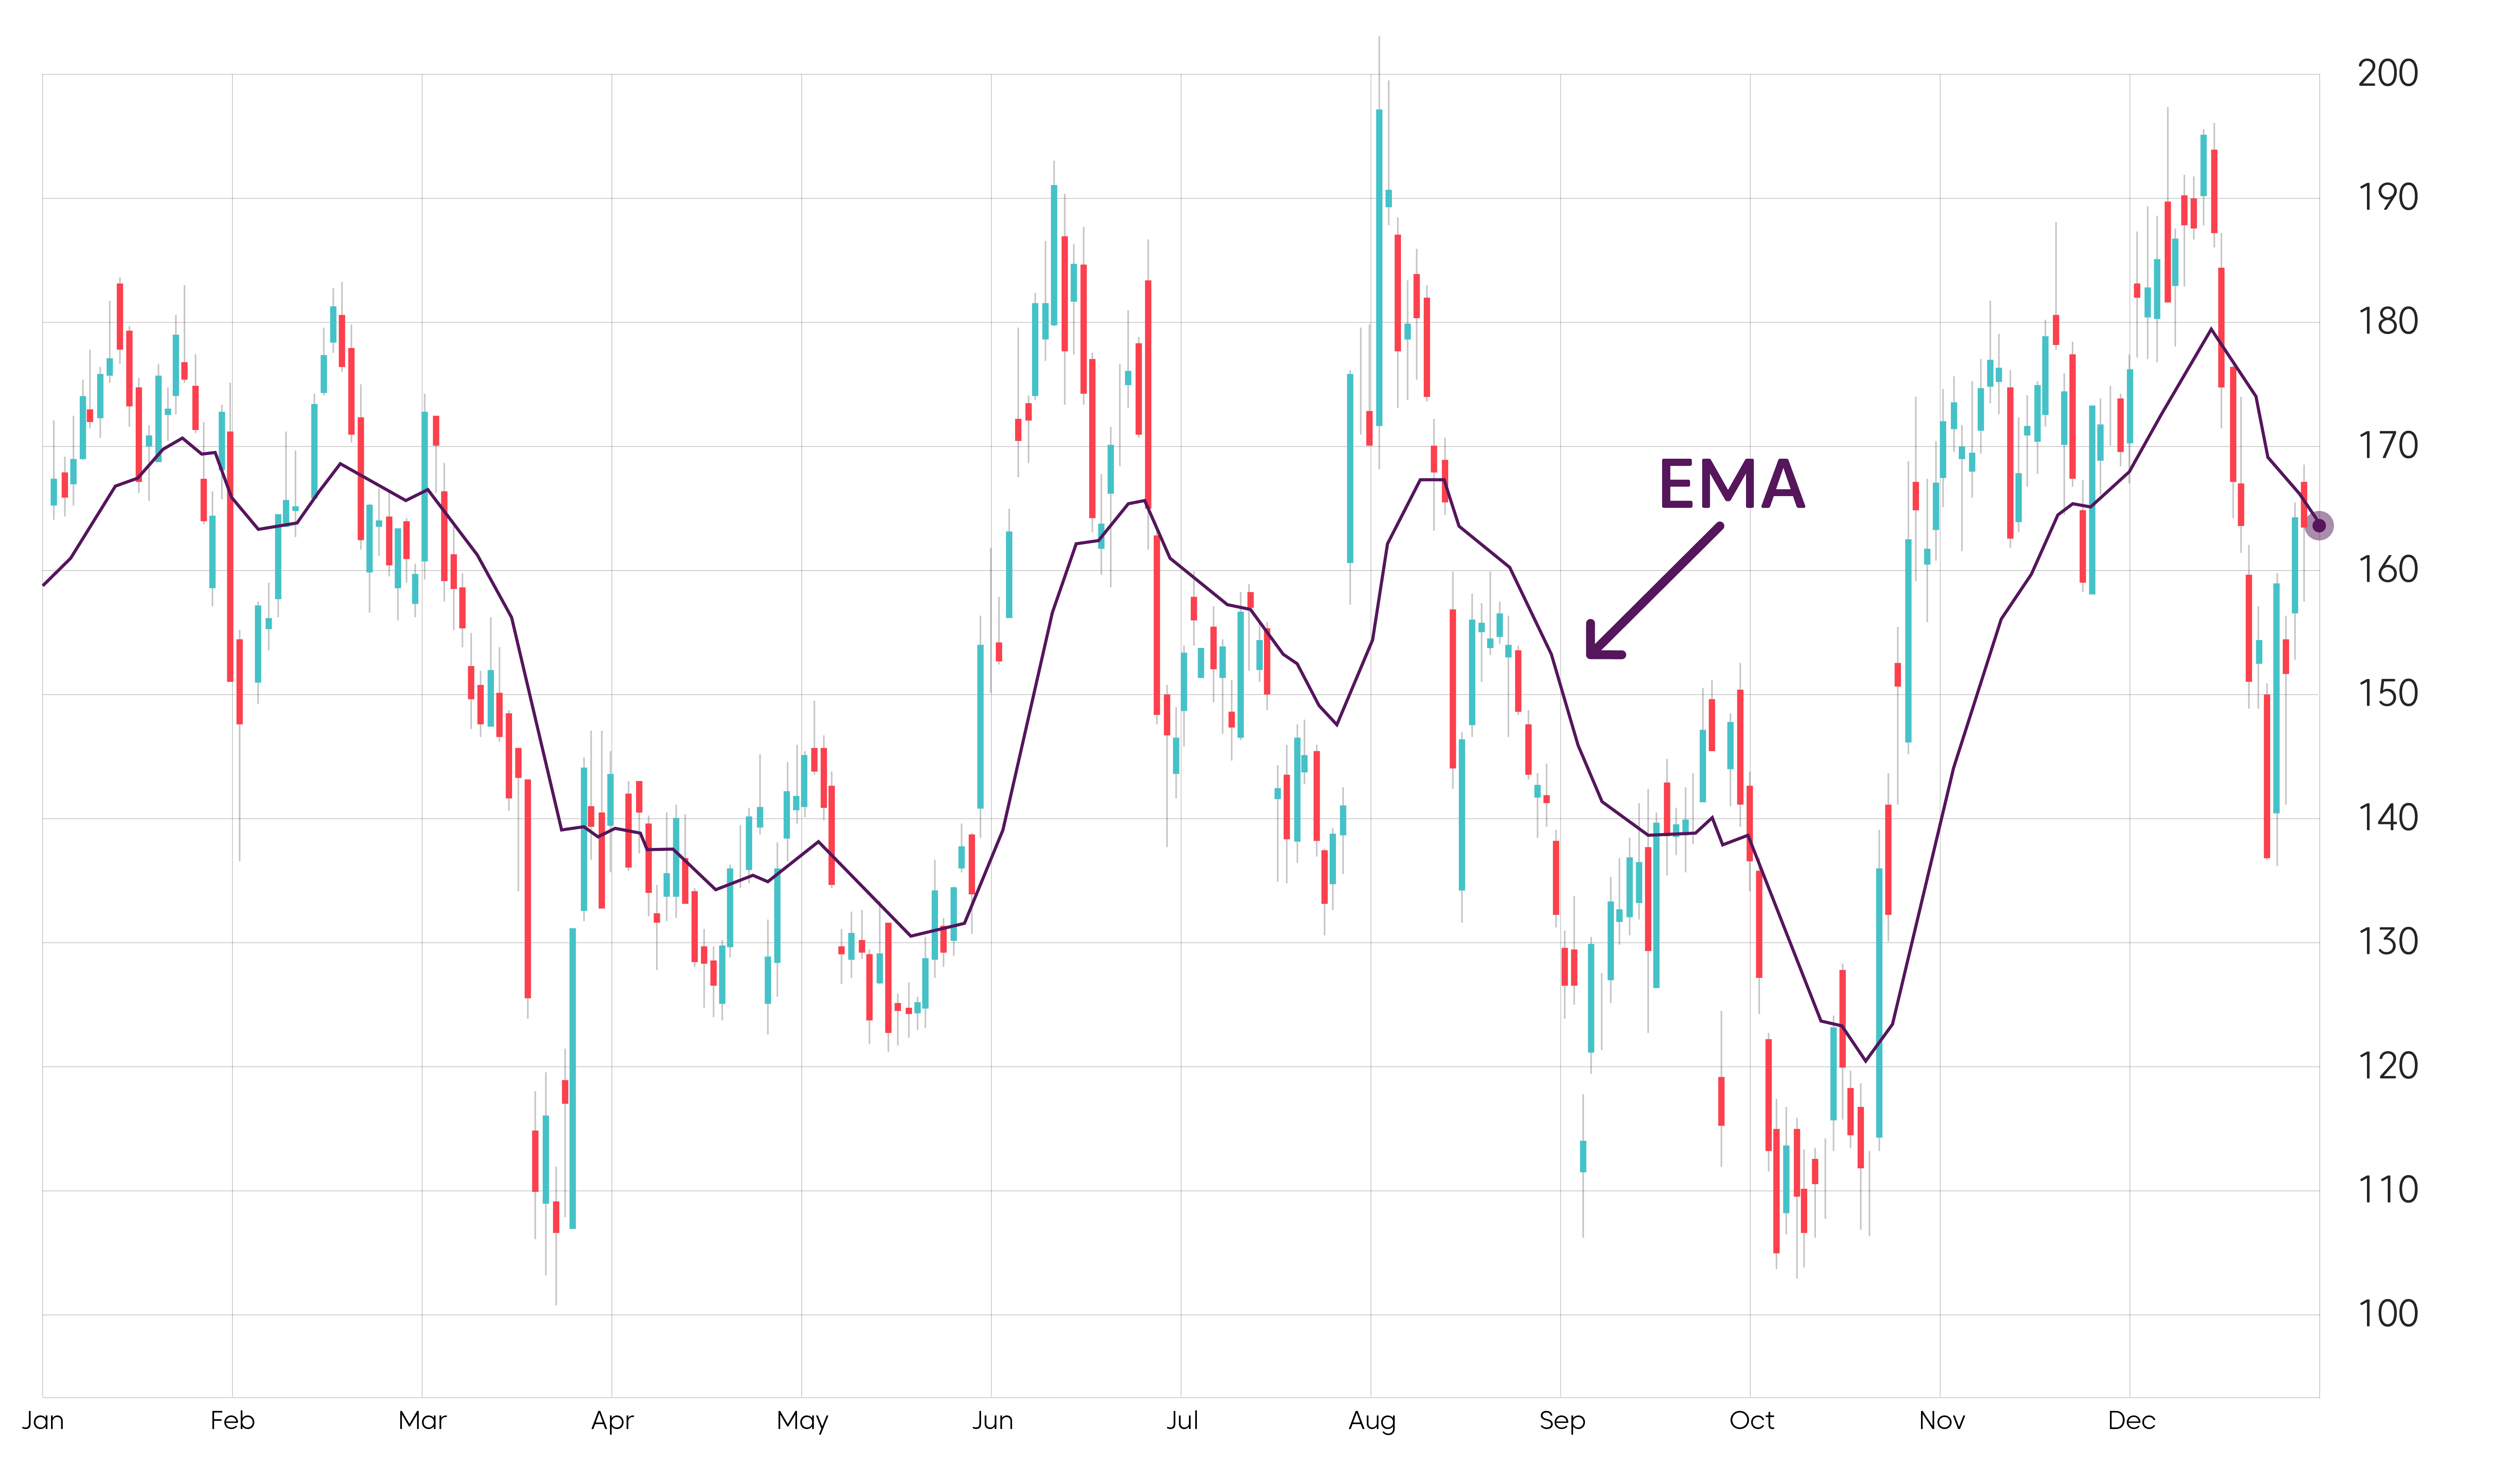
The exponential moving average (EMA) is a type of moving average that is used by traders to smooth out price data. The key difference between the EMA and the simple moving average (SMA) is that the EMA gives more importance to recent price moves, reducing the lag–the delay between actual price movements and the indicator’s response to those movements.
The EMA is one of the most popular technical indicators and is used by both short-term and long-term traders. Common periods for the EMA include 9 and 21 for short-term momentum, while 50, 100, and 200 are typically used for identifying medium- to long-term trends.
The indicator is used to identify trading opportunities and support traders in their decision-making process but can also serve as an active part of a trading strategy (for example, trading EMA crossovers).
The EMA helps traders identify current market conditions, i.e., whether the instrument is in an uptrend, a downtrend, or moving sideways.
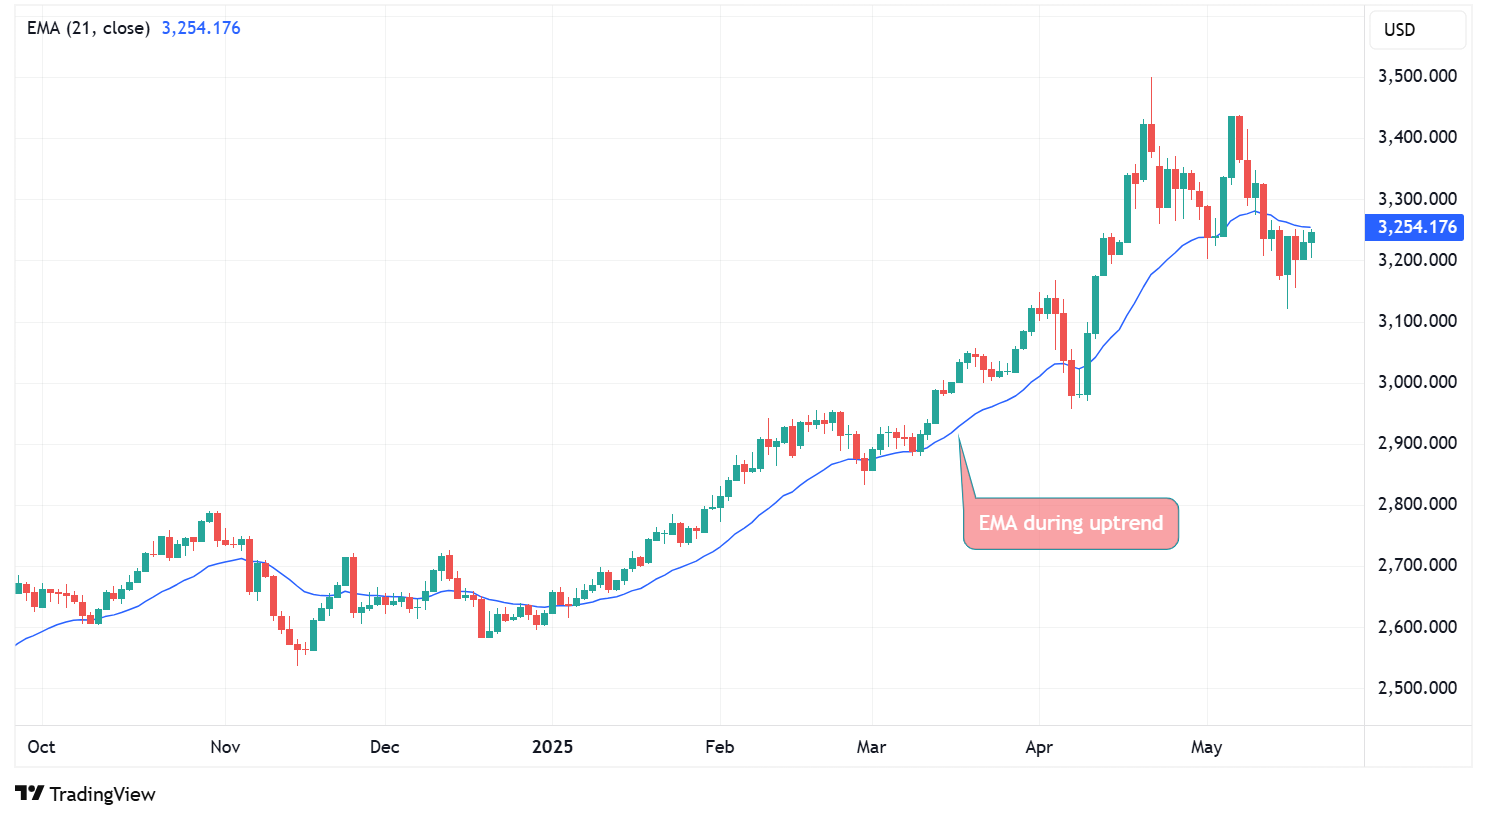
If the price is trading above the EMA, the instrument is currently in an uptrend.
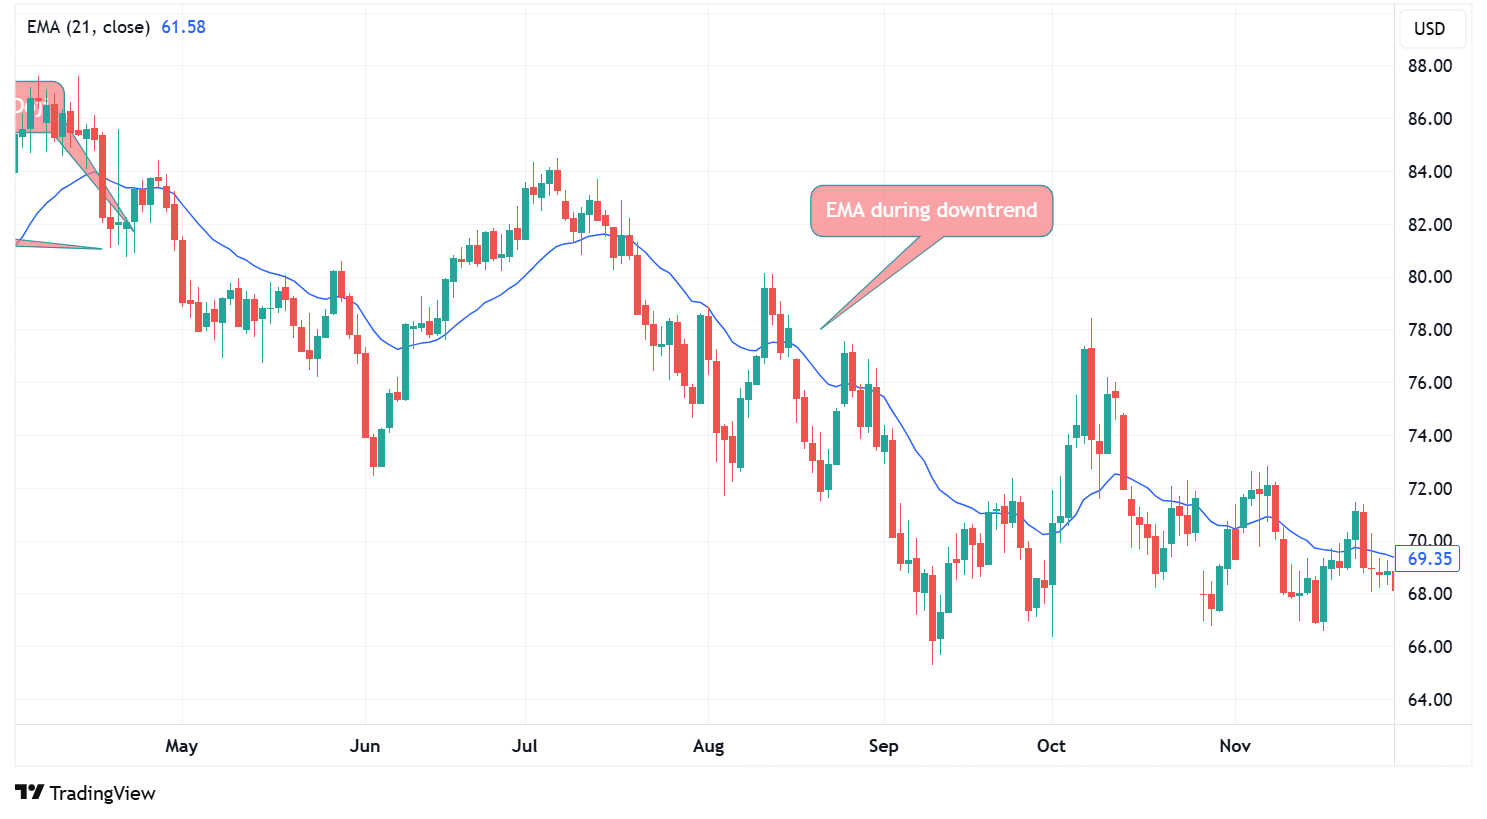
If the price is below the EMA, the instrument is currently in a downtrend.
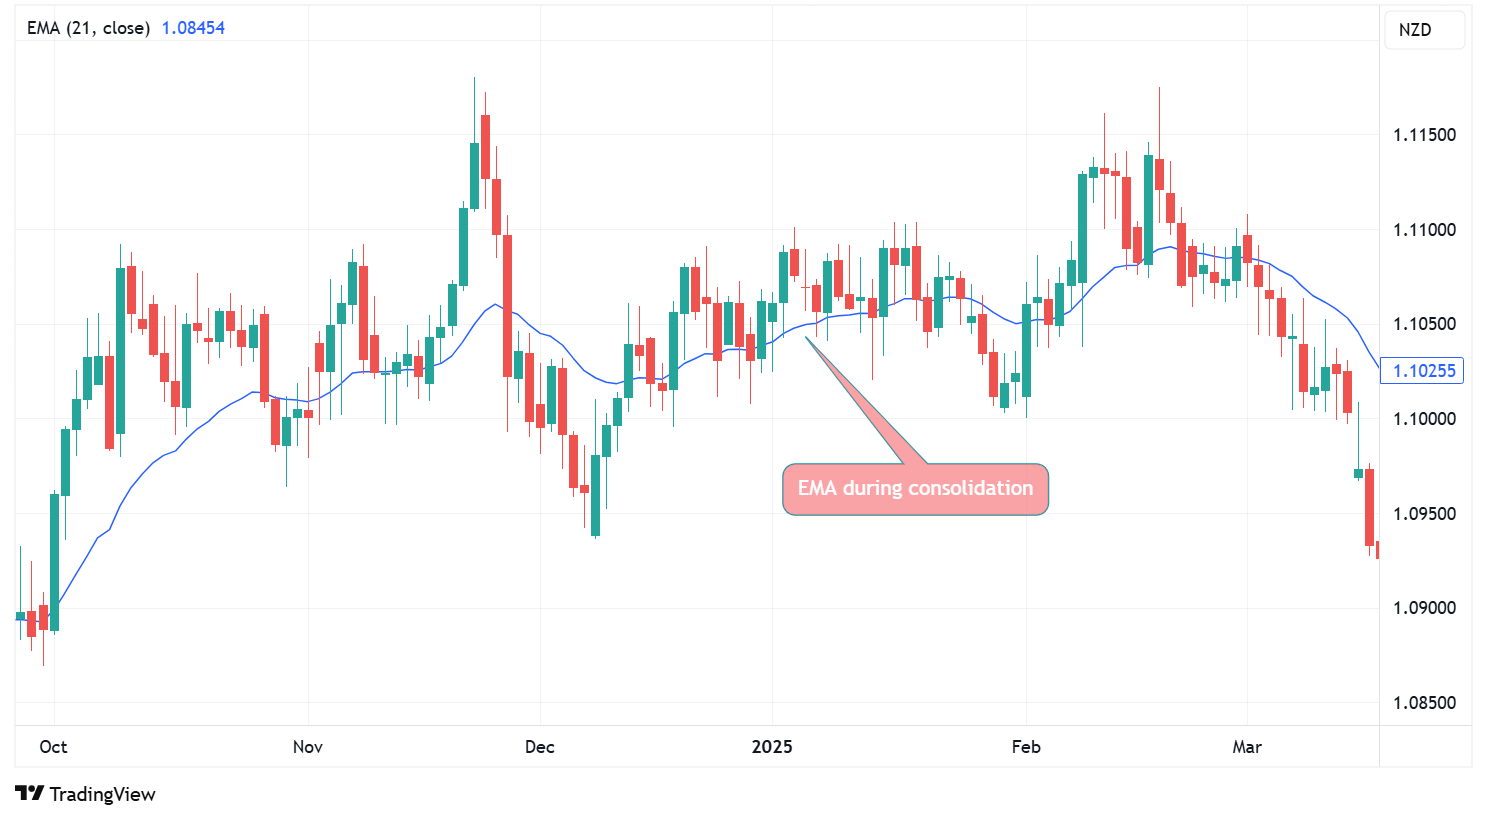
How do we identify if there is no clear trend and the market is moving sideways?
The EMA itself will be almost flat, while price will hover around it with frequent crosses above and below the EMA.
Aside from that, the EMA is frequently incorporated into trading strategies and can help generate signals.
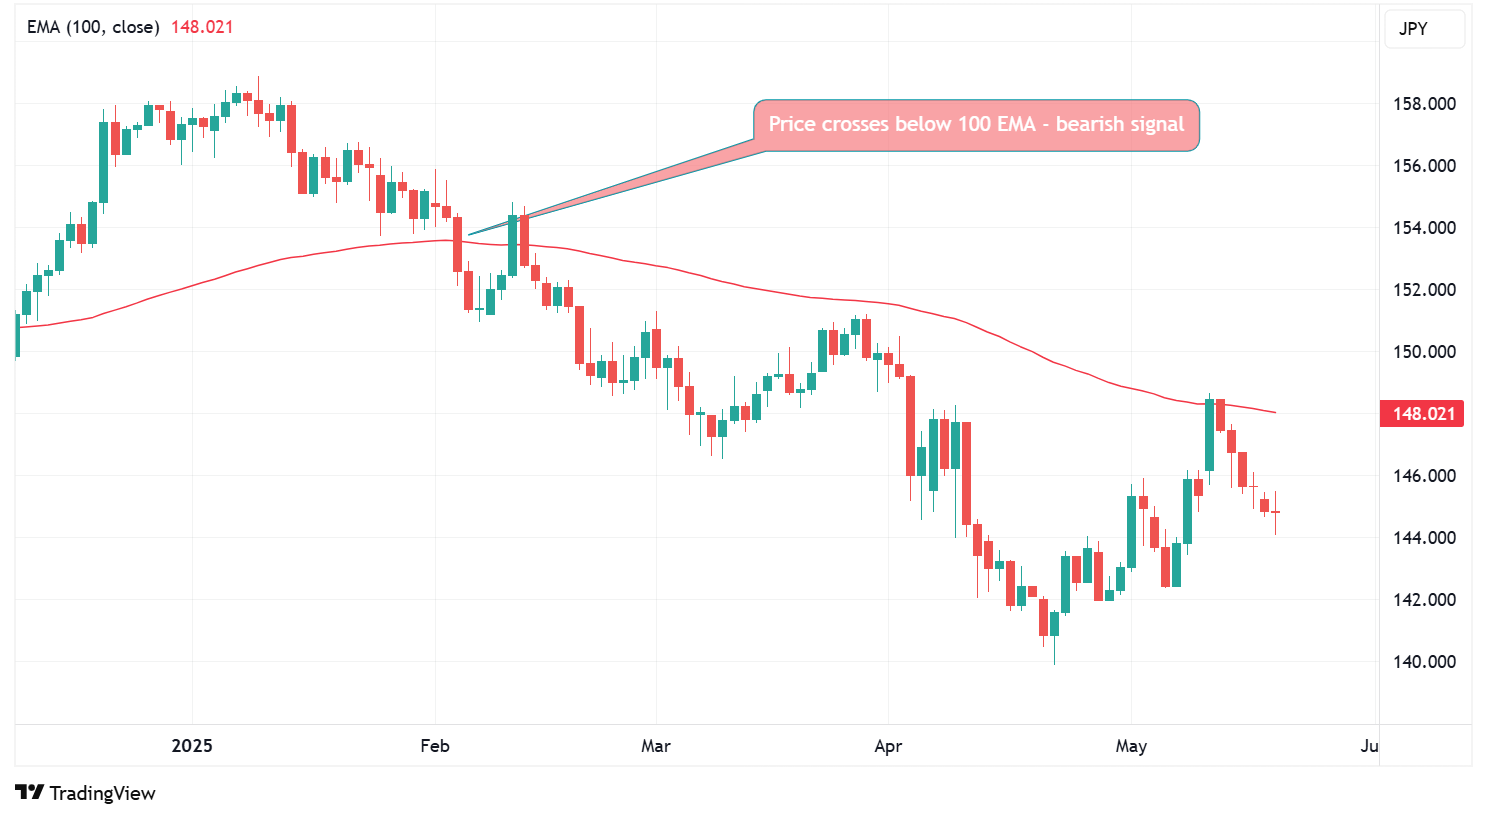
A popular strategy involving the EMA is the price cross. Traders will enter a long position when the price of an instrument crosses above the EMA and a short position when it crosses below it.
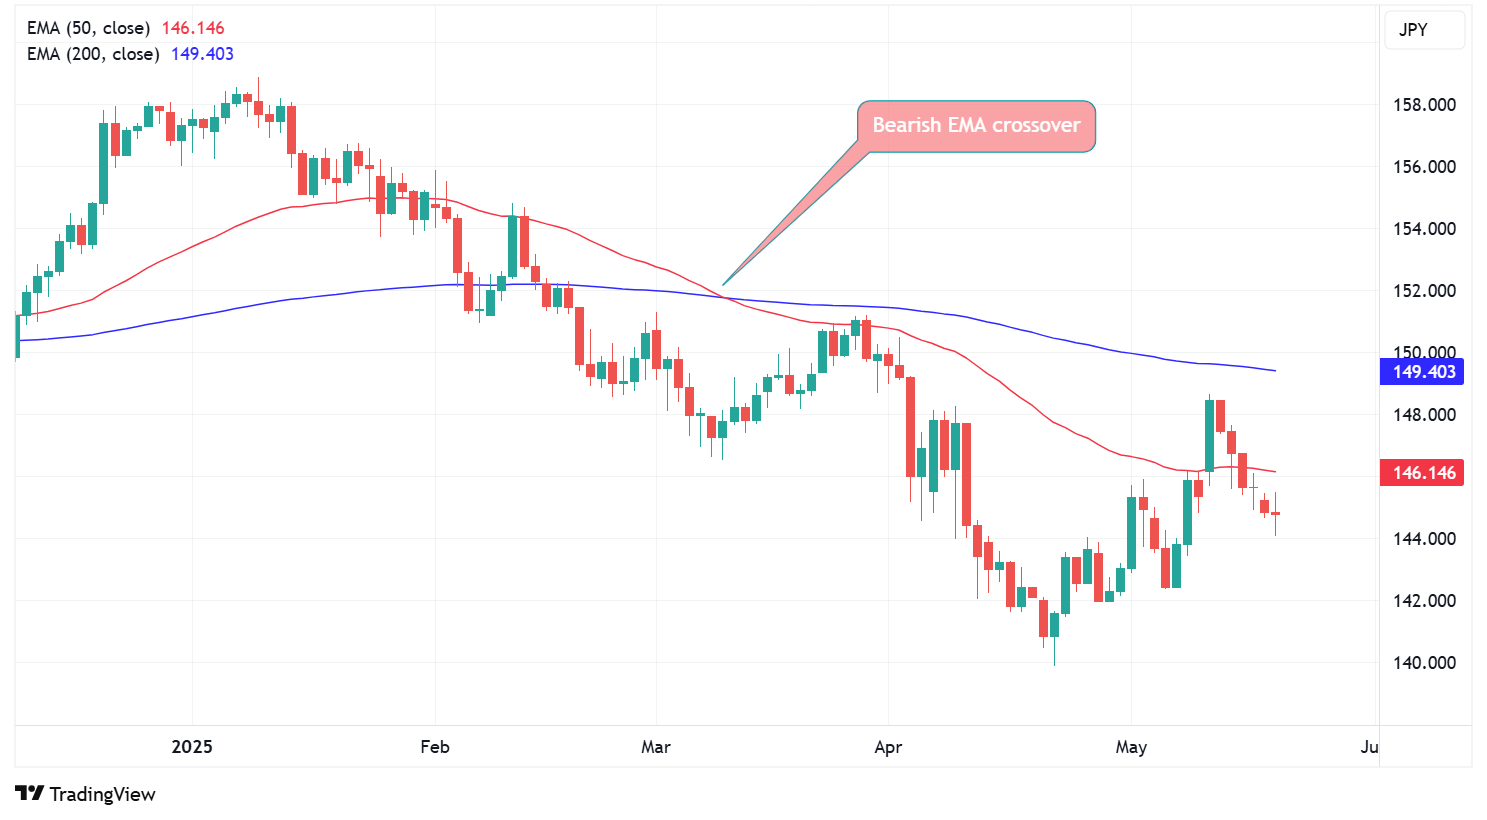
Another variant of this strategy is the EMA crossovers, which occur when a short-term EMA crosses above or below a long-term EMA, generating a signal for traders to act upon.
Furthermore, the EMA can serve as a level of support or resistance.
First, decide the time period for the EMA — for example, 50 days. The period determines how many past prices are considered in the calculation.
To start the calculation, we need an initial value. This is usually done by calculating a Simple Moving Average (SMA) of the first 50 closing prices. This SMA will serve as the first EMA value.
Next, you calculate the smoothing factor, which simply establishes the "weight" or importance of the most recent price in the EMA calculation. The smoothing factor ensures that newer prices have a bigger impact on the EMA, while older prices gradually have less influence.
Once the smoothing factor is established, we will calculate the EMA for the next day by taking the current day’s price, multiplying it by the smoothing factor and adding to that the previous day’s EMA, multiplied by 1 minus the smooth factor.
Finally, we repeat this process for each new day.
The EMA serves as a valuable tool for identifying trends. If the price is above the EMA and the EMA slopes upwards, it signifies an uptrend in the instrument. On the other hand, if the price is below the EMA and the EMA slopes downward, it implies that the instrument is in a downtrend.
There are two main methods that traders use to incorporate the EMA in their trading strategy.
One method involves the crossover between two EMAs, specifically a shorter-period EMA crossing above or below a longer-period EMA. For instance, when a 50-period EMA crosses above a 200-period EMA, this is interpreted as a bullish signal. Conversely, if a 50-period EMA crosses below a 200-period EMA, it is regarded as a bearish signal.
The other method involves waiting for the price to cross either above or below the EMA. For instance, a long position would be entered once the price has crossed above the EMA, anticipating bullish momentum. Conversely, a short position would be initiated when the price crosses below the EMA, expecting bearish momentum. It is essential to confirm that there is an underlying trend, as a period of consolidation can lead to numerous false signals.
While both are types of moving averages, there are several key differences between the EMA and the SMA:
The EMA is a type of moving average in which recent price action has greater weight. This gives it an advantage over the SMA, which is smoother but has a greater lag. It is a popular indicator and widely used by traders, mostly for identifying trends or for generating trade signals.
The EMA is a useful tool as it reacts faster to recent price action, but traders should proceed with caution if markets are moving sideways, as it would generate many false signals.
The EMA can easily be combined with other technical indicators and tools, which can improve the reliability of signals generated by EMA price crosses or crossovers between two EMAs.
Ready to trade your edge?
Join thousands of traders and trade CFDs on forex, shares, indices, commodities, and cryptocurrencies!
This information is not to be construed as a recommendation; or an offer to buy or sell; or the solicitation of an offer to buy or sell any security, financial product, or instrument; or to participate in any trading strategy. It has been prepared without taking your objectives, financial situation and needs into account. Any references to past performance and forecasts are not reliable indicators of future results. Axi makes no representation and assumes no liability with regard to the accuracy and completeness of the content in this publication. Readers should seek their own advice.
FAQ
A type of moving average that gives greater weight to recent price action.
It stands for exponential moving average.
The EMA responds more rapidly to recent price movements, whereas the SMA assigns equal weight to all prices within the specified period.
The most commonly used settings are 9, 21, 50, 100 and 200.
It is possible, but it is always better to combine it with other tools for additional confirmation and filtering out bad signals.
Two common approaches are entering a trade when the price crosses above or below the EMA and using the crossover between two EMAs to signal potential trend changes.
Yes, the EMA can be used on all timeframes.
Yes, it can be used for all instruments.
