What is a cup and handle pattern?
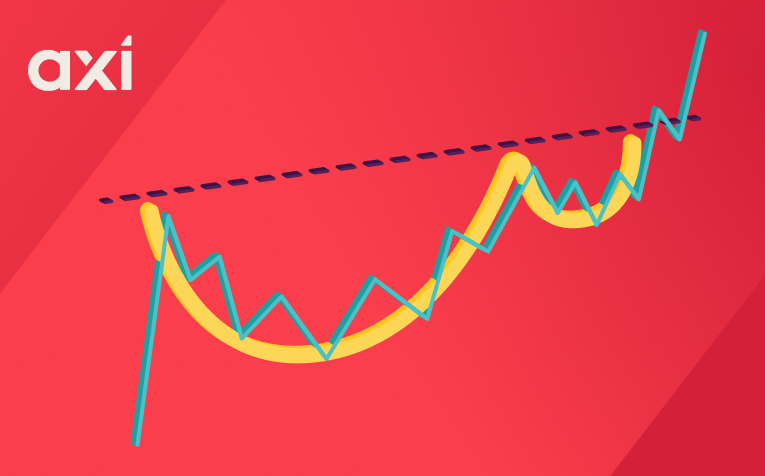
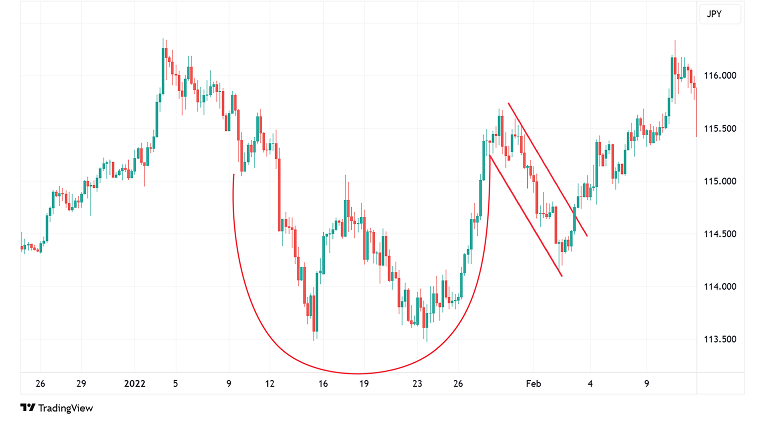
The cup and handle pattern is a bullish chart pattern that indicates a continuation of the existing uptrend. It is called "cup and handle" due to its structure, which consists of a "U"-shaped bottom (cup) and a consolidation that slopes to the downside (forming a handle).
Is a cup and handle bullish or bearish?
The cup and handle pattern is strictly a bullish chart pattern. It appears during an existing uptrend and signals a consolidation until a breakout above the resistance level eventually paves the way for a continuation of the trend. The bearish variant of this chart pattern is called the "inverted cup and handle".
How to identify a cup and handle
Spotting a cup and handle pattern can be trickier compared to other chart patterns, such as pennants or wedges.
Initially, the cup should be identified as a "U"-shaped formation with a rounded bottom. Critically, the pattern must form within an existing uptrend. The cup's rims should align closely, though minor variations are acceptable.
The handle will form after the cup, normally near the rim. It represents a short-term consolidation in the form of a downward-sloping channel or triangle. The handle is generally small, and the retracement should not exceed 50% of the cup’s depth.
How to trade a cup and handle chart pattern
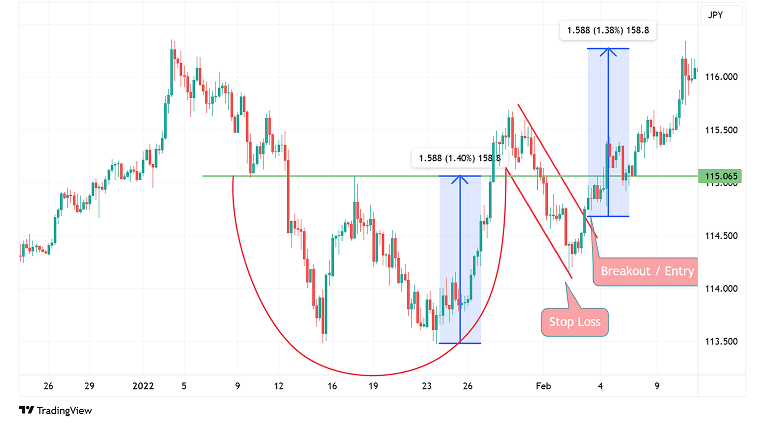
Once a cup and handle pattern is identified, we watch for a breakout above the cup's rim, indicating a potential continuation of the uptrend.
Traders typically enter a long position upon a breakout. Crucially, risk management dictates placing a stop-loss order below the handle's low.
For take-profit, a common approach is to measure the cup's depth (bottom to rim) and project that distance upward from the breakout. For example, a 200-pip cup depth suggests a 200-pip take-profit target above the entry.
Advantages of cup and handle
Trading cup and handle patterns has several advantages, which include:
- The entry and exit levels are clearly defined, i.e., the entry happens once the breakout is confirmed, and the depth of the cup can be used to project the take-profit level.
- The pattern can appear on various timeframes, which means it can be utilised by both short-term and long-term traders.
- Technical indicators can complement the pattern for added reliability. For example, traders may use the Relative Strength Index (RSI) to identify overbought and oversold conditions.
- The pattern can appear on price charts of various trading instruments, varying from forex to commodities and stocks.
Disadvantages of cup and handle
- The pattern can be difficult to identify, particularly compared to other chart patterns such as wedges or pennants.
- The pattern is not as clearly defined as other patterns, which can make identifying it subjective.
- If traded on higher timeframe charts, the formation of the pattern can take a long time.
- As with any chart pattern, false breakouts can occur.
- The pattern should only be traded during an existing uptrend.
Conclusion
The cup and handle pattern is a chart pattern that indicates the continuation of an existing uptrend. It consists of a U-shaped bottom (cup) and a triangle or channel that represents the handle. The cup and handle pattern is strictly bullish, and its bearish variant is known as an inverted cup and handle.
The pattern can appear on various timeframes and price charts of various trading instruments, giving traders flexibility. However, it is rather difficult to spot compared to many other chart patterns, and its structure can make spotting it a very subjective matter.
Ready to trade your edge?
Join thousands of traders and trade CFDs on forex, shares, indices, commodities, and cryptocurrencies!
This information is not to be construed as a recommendation; or an offer to buy or sell; or the solicitation of an offer to buy or sell any security, financial product, or instrument; or to participate in any trading strategy. It has been prepared without taking your objectives, financial situation, or needs into account. Any references to past performance and forecasts are not reliable indicators of future results. Axi makes no representation and assumes no liability regarding the accuracy and completeness of the content in this publication. Readers should seek their own advice.

Milan Cutkovic
Milan Cutkovic is an experienced trader and market analyst specializing in forex, indices, commodities, and stocks. He was one of the first traders accepted into the Axi Select program, which identifies talented traders and supports their professional development.
He is passionate about helping others improve their trading skills through educational articles, eBooks, and content published on the Axi blog. His work is regularly featured and quoted in major international media outlets, including Yahoo Finance, Business Insider, Barron's, CNN, Reuters, New York Post, and MarketWatch.