What is the Stochastic Oscillator indicator?
The Stochastic Oscillator is among the most popular indicators used by traders. It is a momentum indicator that was developed in the 1950s by Dr. George C. Lane, who contributed significantly to the evolution of technical analysis.
The key difference between the Stochastic Oscillator and tools that were used at that time is that Lane decided to focus on momentum rather than moving averages.
Lane believed that before a price reversal happens, momentum will slow down, which is why he created this indicator that compares the closing price of the instrument to its historical price ranges.
Understanding the Stochastic Oscillator
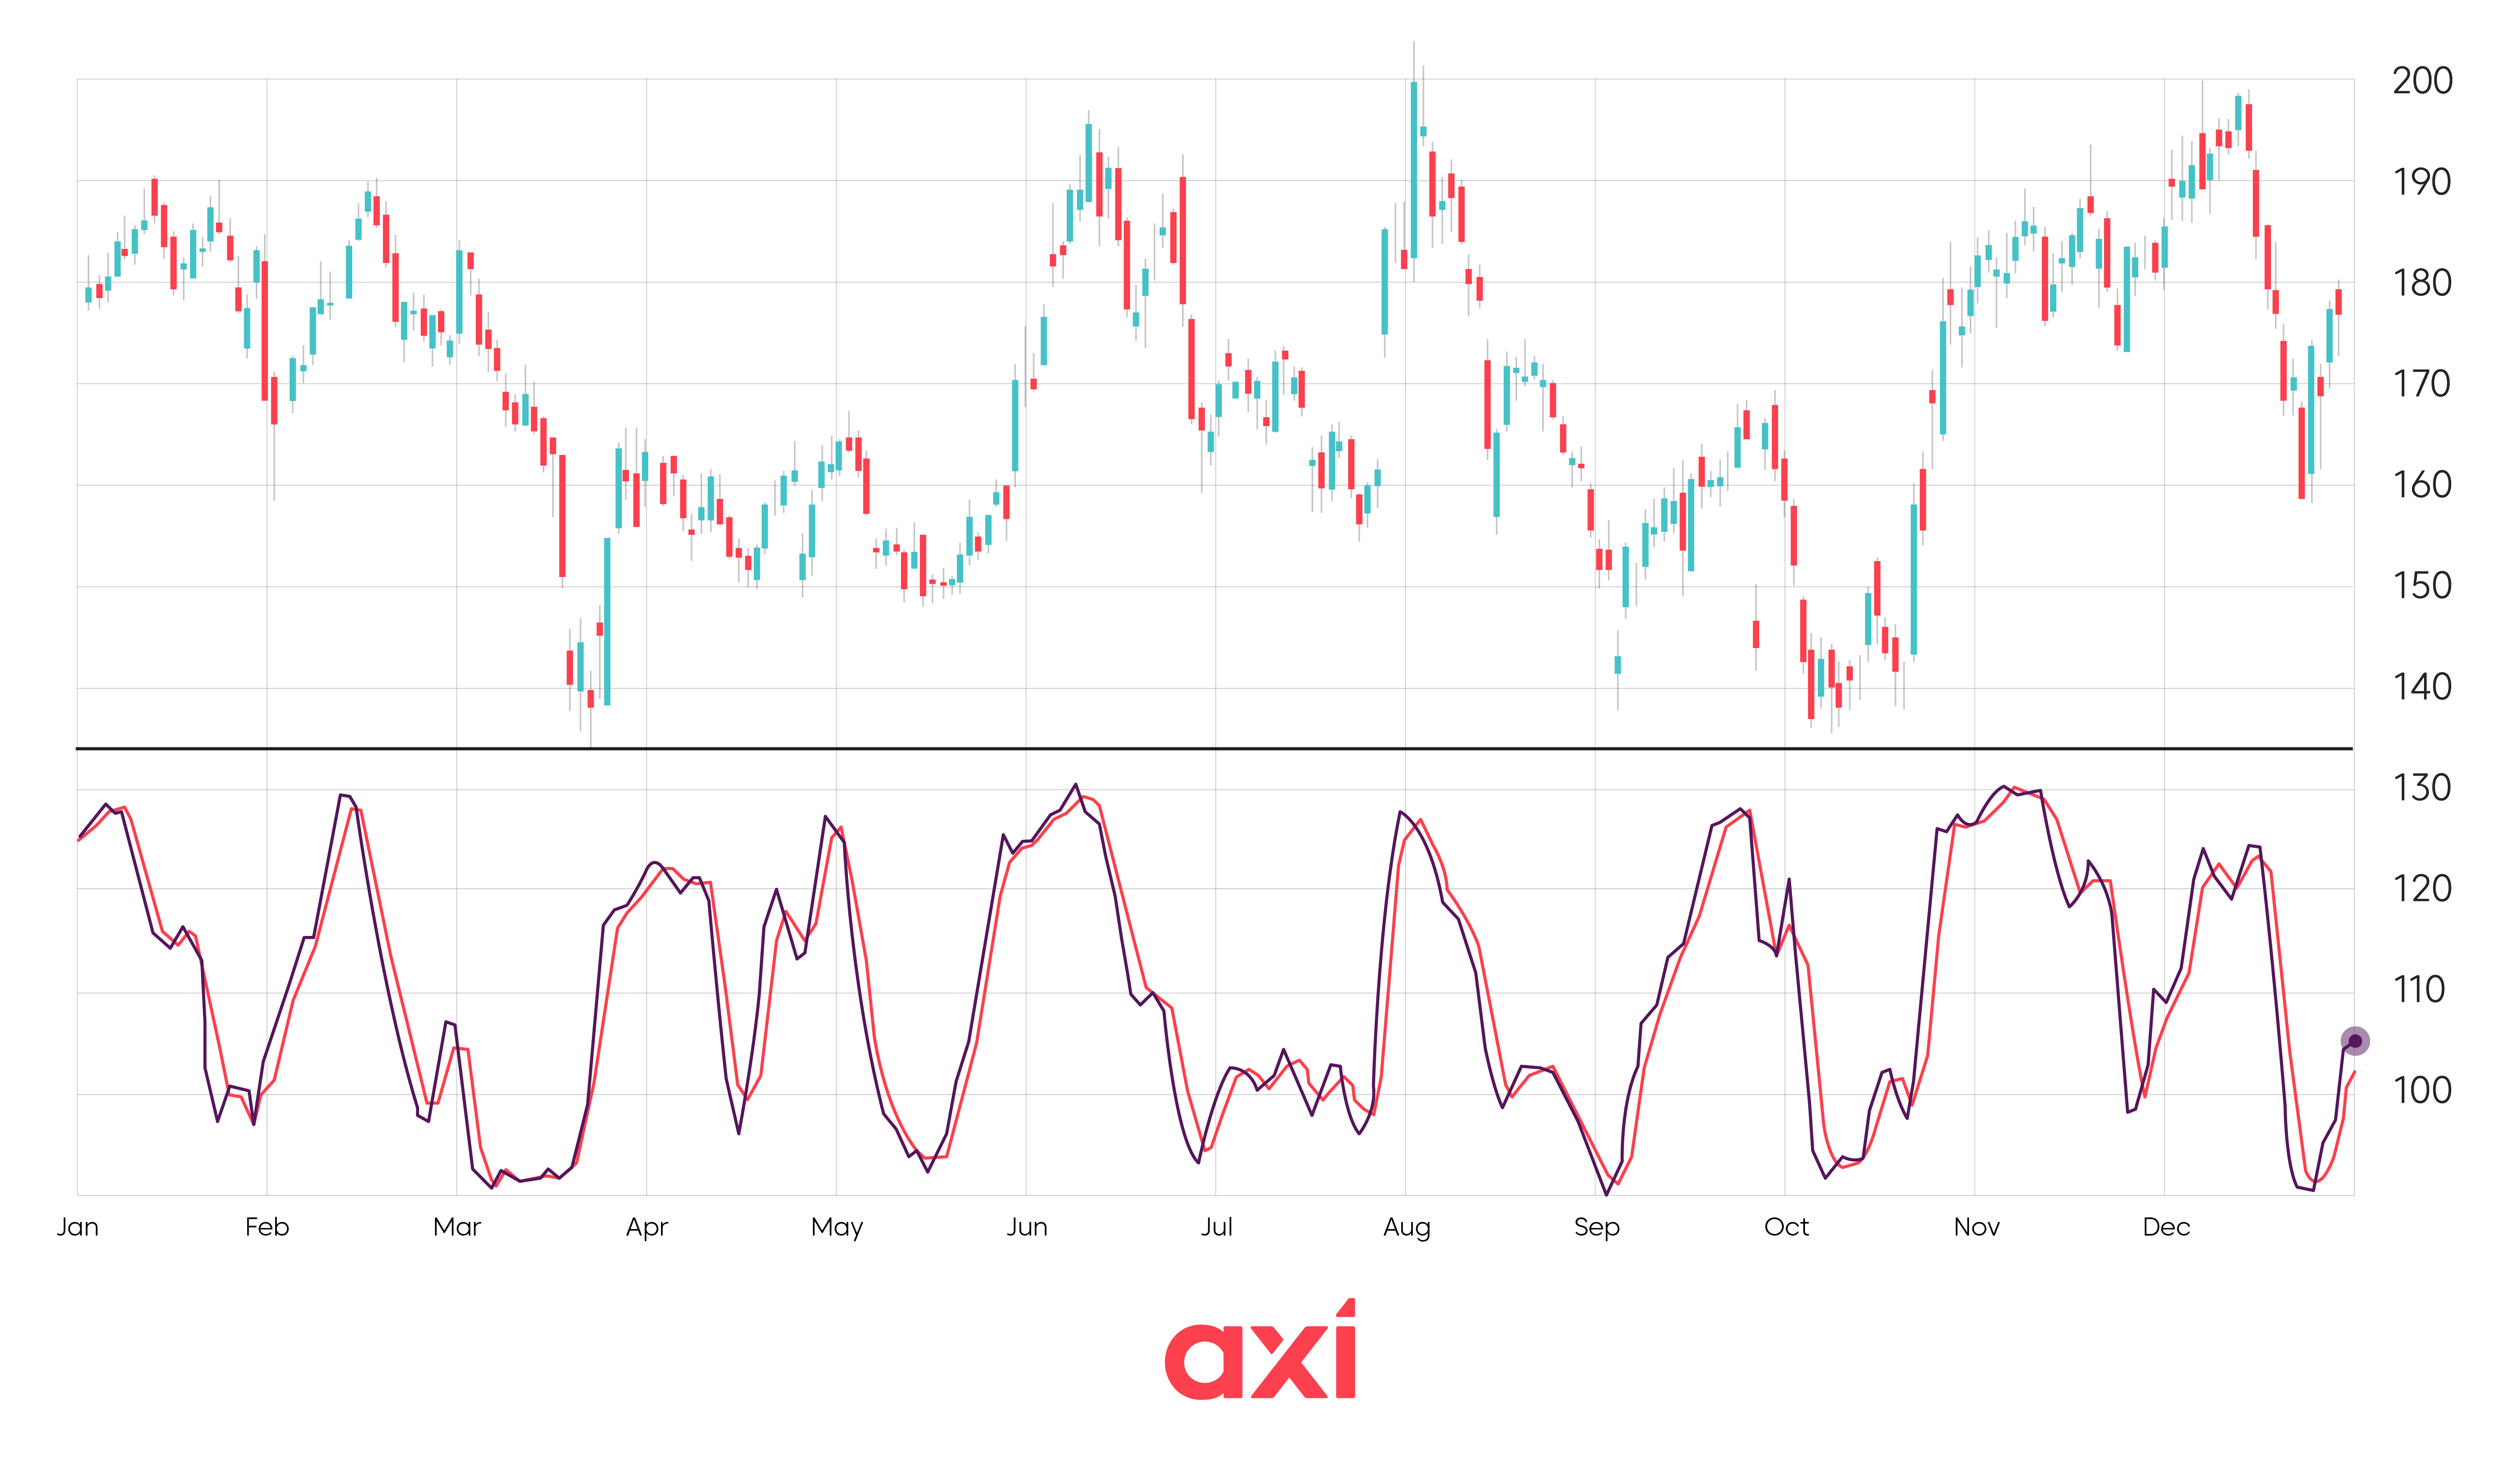
The indicator compares the closing price of the instrument to the price range over a certain period of time. The standard setting for the Stochastic Oscillator is often 14 periods - i.e., we are comparing the closing price to the trading range over the past 14 periods to identify potential reversal points.
The Stochastic Oscillator ranges from 0 to 100 and consists of two lines:
- %K = the fast line that reacts much quicker to price changes.
- %D = the slow line which represents the 3-period average of the %K line.
As mentioned, the indicator gives us a value between 0 and 100. A value of zero would mean that the price closed at the low of the period (for example, the past 14 days). A value of 100 would mean that the price closed at the high of that period.
Stochastic Oscillator formula
%K Line = (Most recent closing price - low of the period) / (high of the period - low of the period) × 100
Meanwhile, the %D line is simply an average of the 3 most recent %K values.
Let’s illustrate it with an example.
The share price of Apple fluctuated between $180 and $220 in the past 14 days.
The most recent closing price was $210.
%K = (210 - 180) / (220 - 180) x 100 = 75
The Stochastic Oscillator is located in the upper part of the range, suggesting bullish momentum, but also that Apple has not reached overbought territory yet.
Fast vs slow Stochastic Oscillator
The key difference between the fast and slow Stochastic Oscillator is how the %D line is calculated.
With the fast stochastic, the %D line is calculated as the average of the 3 most recent %K values. With the slow stochastic, it a 3-period average of the Fast %D.
The fast stochastic is more sensitive to recent price action and generates more signals. Meanwhile, the slow stochastic is better in filtering out noise and gives fewer signals, but with greater accuracy.
Example of the Stochastic Oscillator
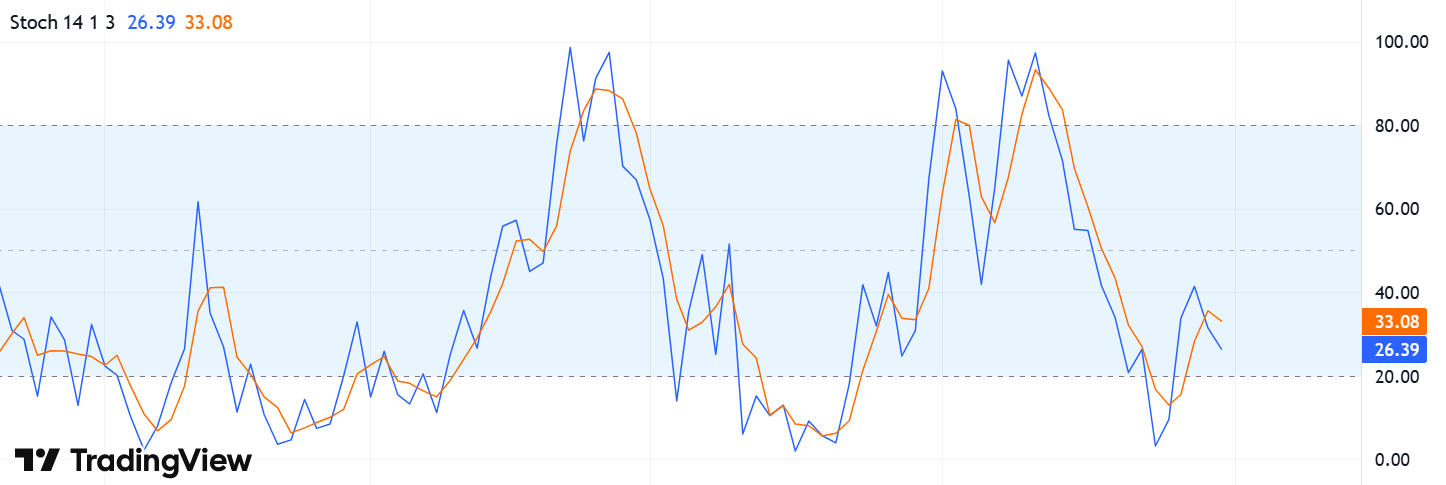
How to read the Stochastic Oscillator
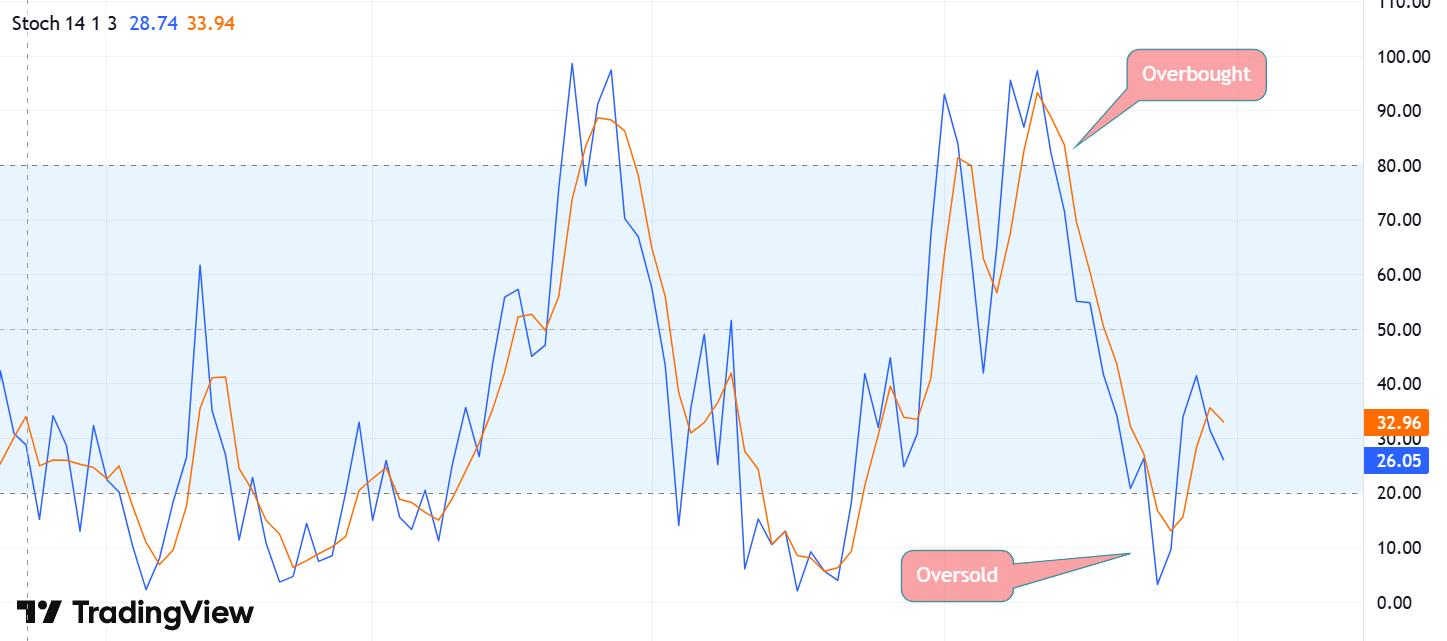
One of the key functions of the Stochastic Oscillators is to help traders identify overbought and oversold conditions.
If the indicator is above 80, it indicates overbought conditions and that traders should watch out for a potential reversal to the downside.
A reading below 20 on the other hand would signal oversold conditions, and that traders should be anticipating a potential bullish reversal.
If the Stochastic Oscillator is hovering around 50, it is in neutral territory.
How to use it
As illustrated previously, the Stochastic Oscillator can help traders identify overbought and oversold conditions.
Does that mean we simply buy an instrument as soon as it reaches oversold territory or sell it as soon as it reaches overbought territory?
No, as that alone is not a reliable signal. As we can see below, an instrument can stay in overbought or oversold territory for a long time.
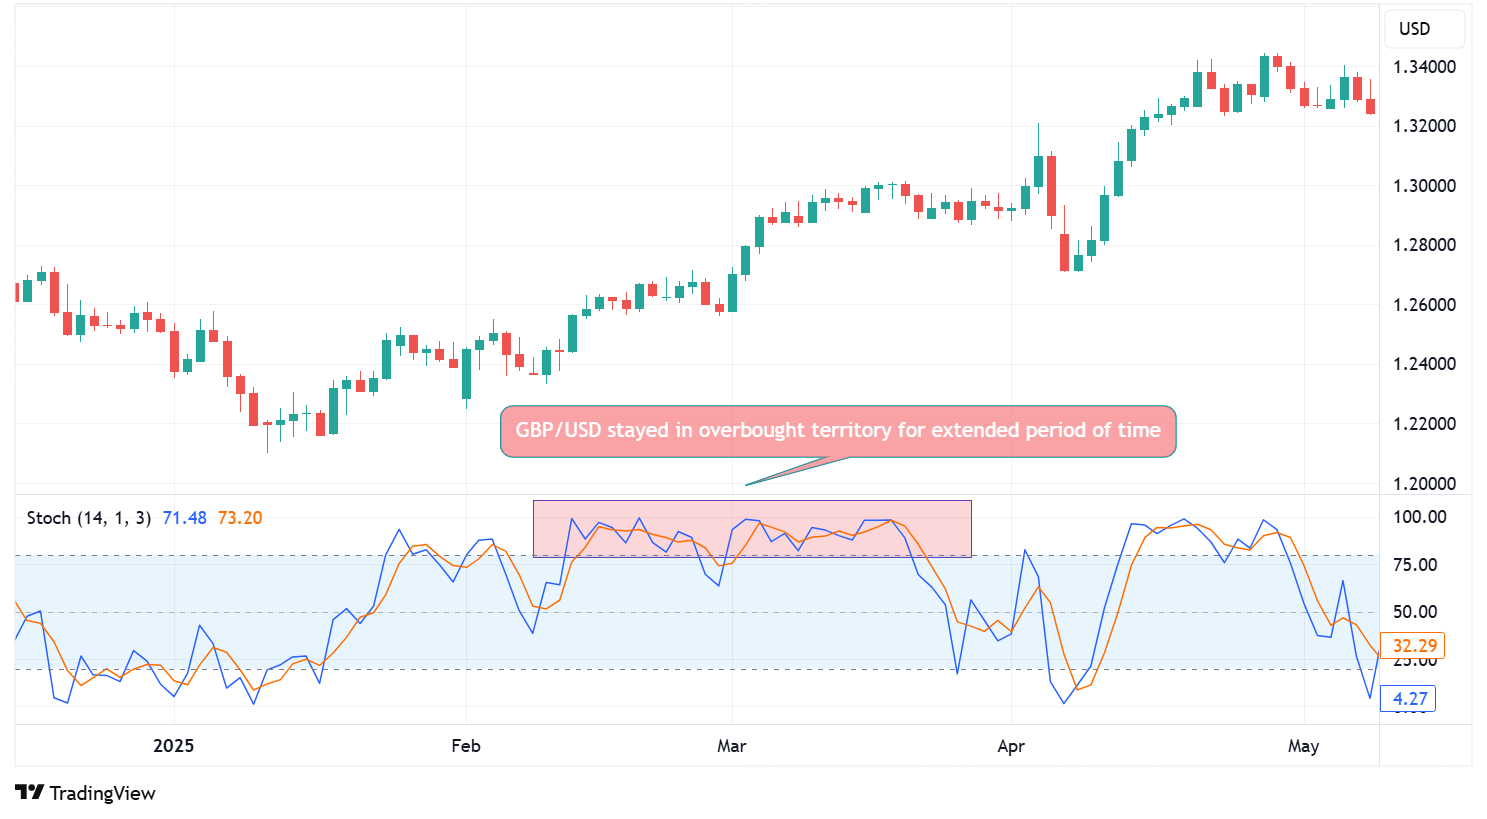
Rather, the Stochastic Oscillator should be used as a supporting tool. For example, did the instrument reach a key resistance level and was rejected there? Was a bearish candlestick pattern spotted? This would improve the quality of the signal.
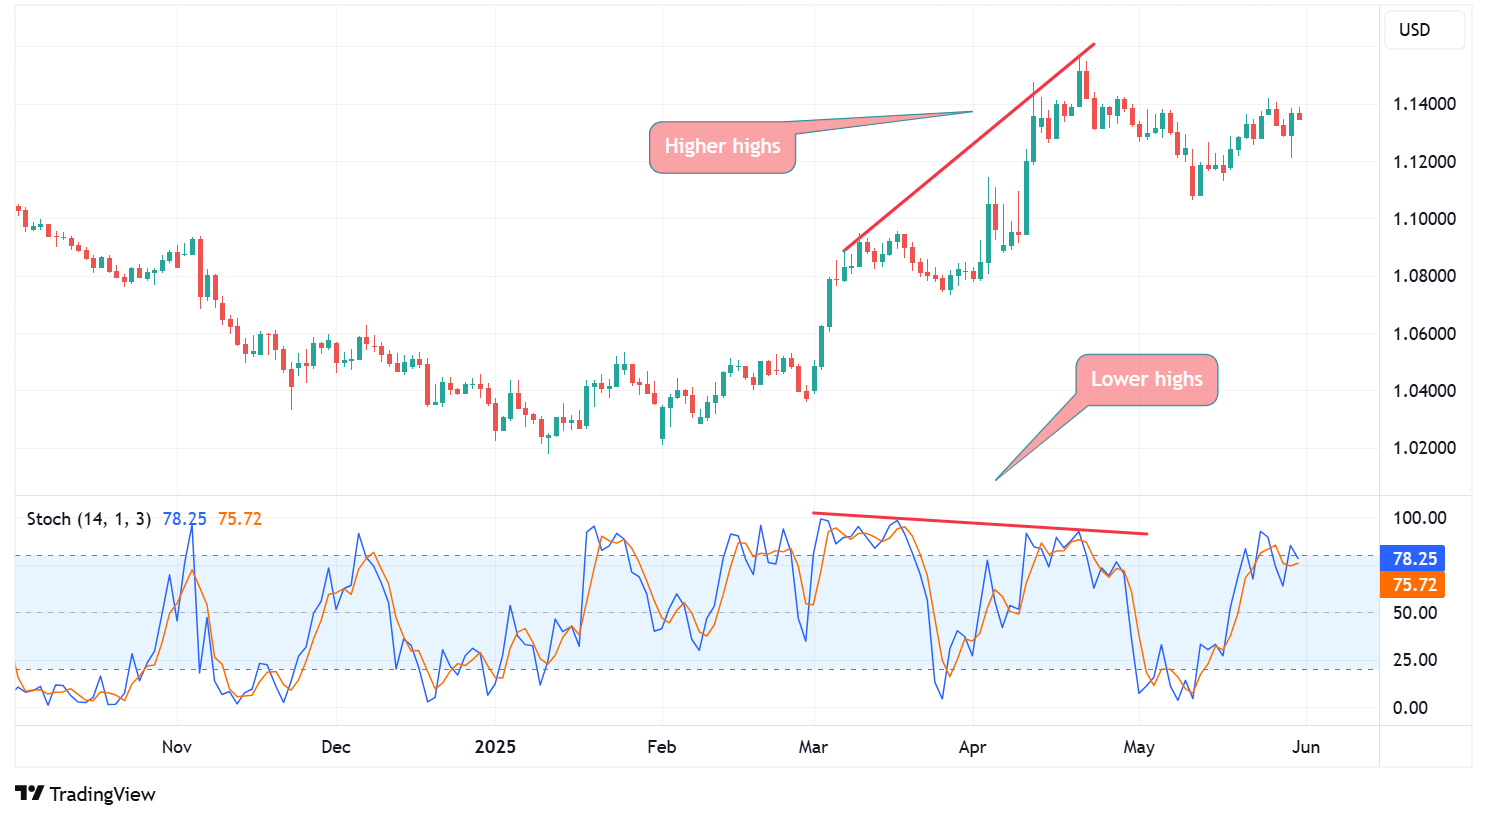
Stochastic divergence is another method of how to make use of this indicator. With divergence, we are looking for the instrument’s price posting higher highs or lower lows while the stochastic indicator is not.
Let’s look at an example where price is posting higher highs, but the Stochastic Oscillator fails to follow. This would indicate a bearish divergence and support the case for a bearish trend reversal.
Here, we have an example of price posting lower lows, but the Stochastic Oscillator not following. This shows a bullish divergence and indicates a potential bullish trend reversal.
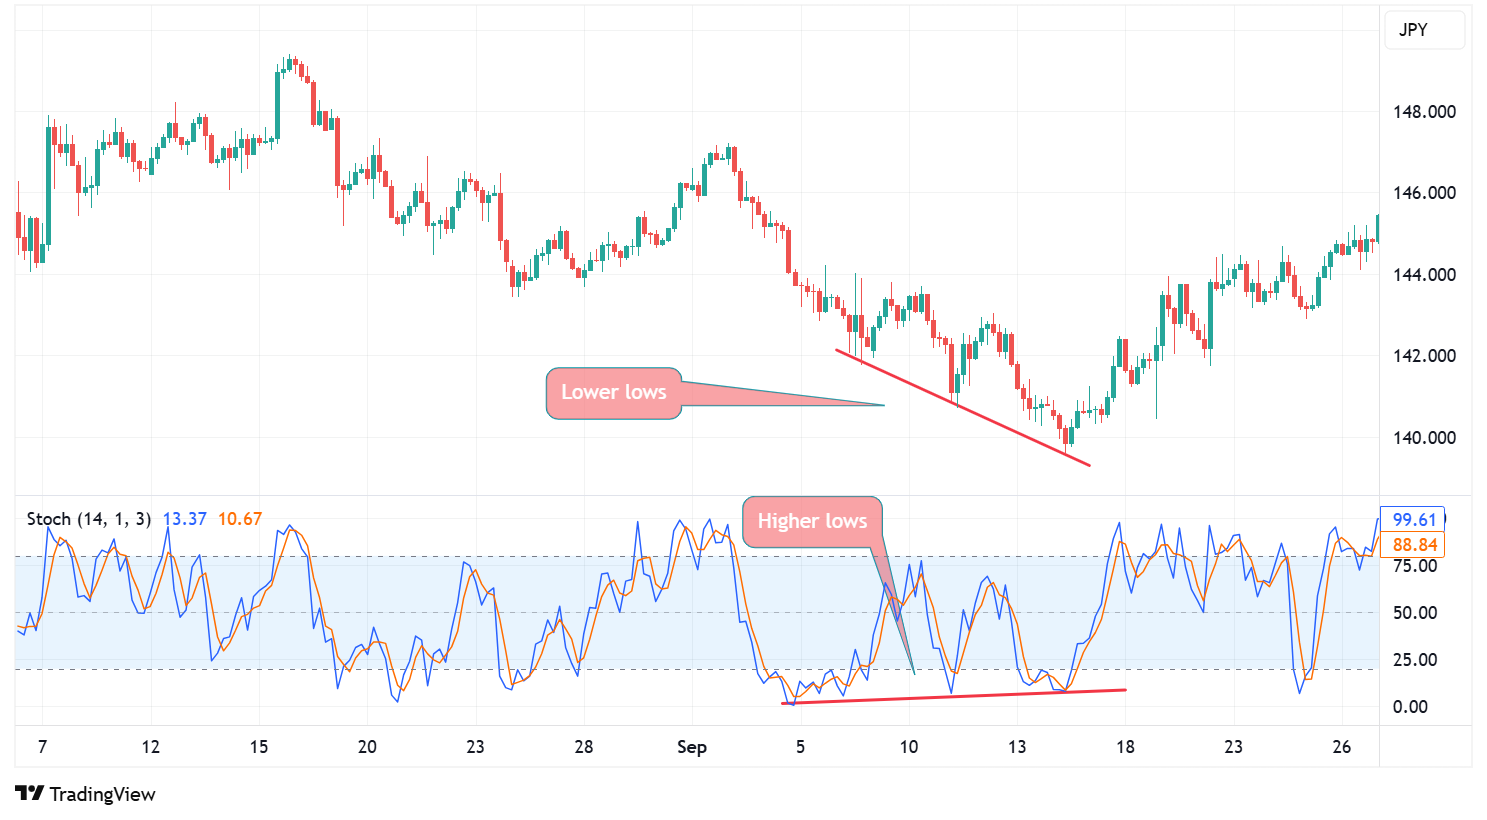
Again, the divergence alone should not be used as a trading signal, but rather as a supporting tool.
Is there a strategy where the Stochastic Oscillator actually generates the signal?
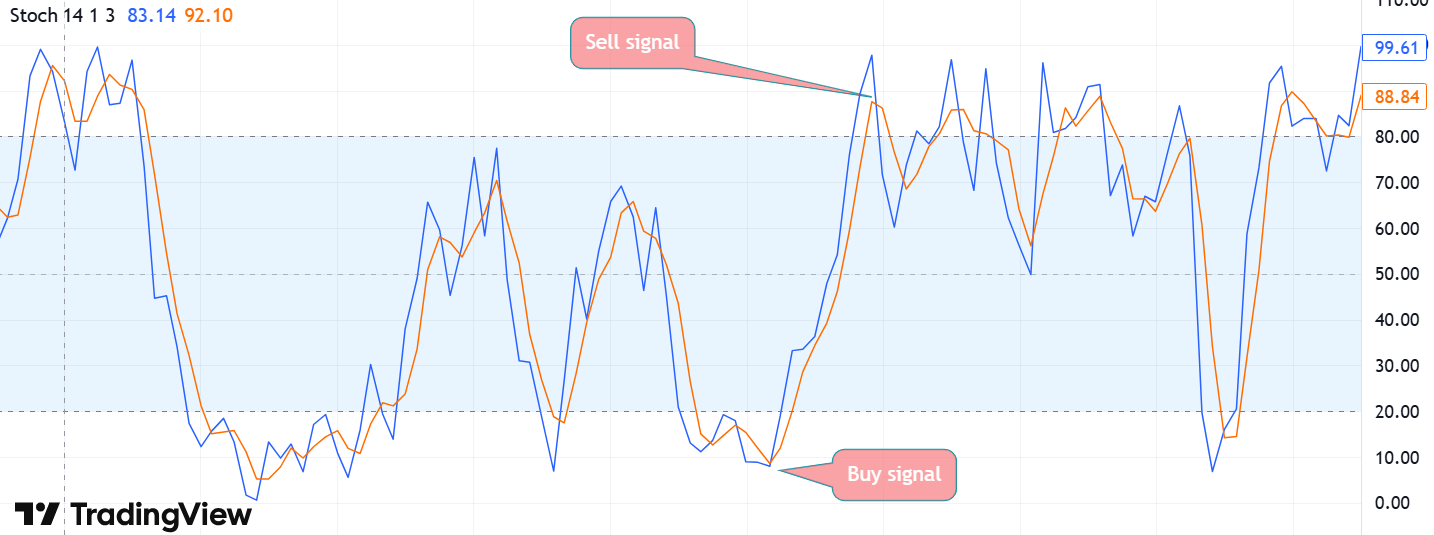
Yes, when trading stochastic crossovers, it is the indicator itself that generates the buy or sell signal.
For a buy signal, we are looking for the %K line to cross above the %D line while in oversold territory. For a sell signal, we are looking for the %K line to cross below the %D line while in overbought territory.
Pros and cons of the Stochastic Oscillator
The Stochastic Oscillators has several pros that made it one of the most widely used indicators:
- It helps traders to identify overbought and oversold market conditions.
- It can be used as a supporting tool or to generate trade signals (stochastic crossover).
- It helps traders identify momentum shifts.
- It can be used on all chart timeframes of all trading instruments.
- It is suitable for both short-term and long-term traders.
- It can easily be customised and combined with other indicators or tools.
That being said, there are several cons that traders need to be mindful of:
- As with any indicator, it can generate false signals.
- Overbought and oversold conditions should not be seen as trade signals on their own, as markets can stay overbought or oversold for an extended period of time.
- Traders should be mindful of the settings applied to the indicator, as it a fast-moving stochastic could lead to many false signals, while a slow-moving one could lag too much.
Conclusion
The Stochastic Oscillator is a popular momentum indicator used by traders to identify potential reversal points. It ranges from 0 to 100 and consists of two lines – the %K and %D line. The indicator helps traders identify overbought and oversold market conditions and can be used as a supporting tool or as a generator of trade signals.
The Stochastic Oscillator signalling overbought or oversold condition should not be used as a trade signal on its own but rather be combined with other tools. As with any indicators, the Stochastic Oscillator can generate false signals, especially the fast-moving stochastic.
Ready to trade your edge?
Join thousands of traders and trade CFDs on forex, shares, indices, commodities, and cryptocurrencies!
This information is not to be construed as a recommendation; or an offer to buy or sell; or the solicitation of an offer to buy or sell any security, financial product, or instrument; or to participate in any trading strategy. It has been prepared without taking your objectives, financial situation and needs into account. Any references to past performance and forecasts are not reliable indicators of future results. Axi makes no representation and assumes no liability with regard to the accuracy and completeness of the content in this publication. Readers should seek their own advice.

Milan Cutkovic
Milan Cutkovic is an experienced trader and market analyst specializing in forex, indices, commodities, and stocks. He was one of the first traders accepted into the Axi Select program, which identifies talented traders and supports their professional development.
He is passionate about helping others improve their trading skills through educational articles, eBooks, and content published on the Axi blog. His work is regularly featured and quoted in major international media outlets, including Yahoo Finance, Business Insider, Barron's, CNN, Reuters, New York Post, and MarketWatch.